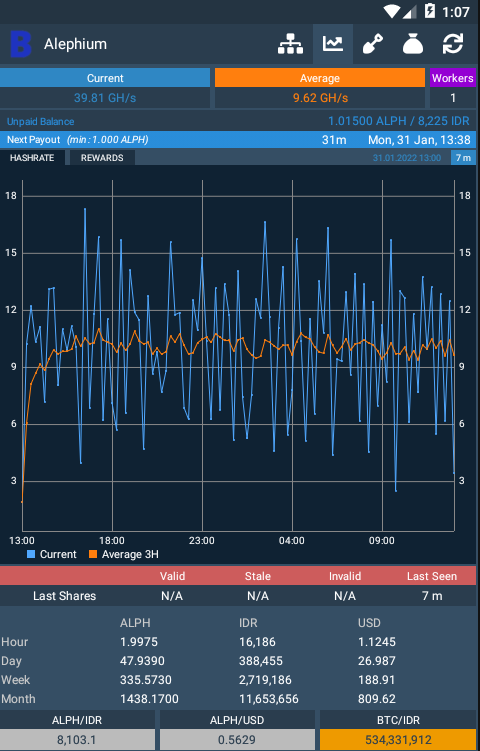
The hashrate chart we plot using the API : https://api.metapool.tech/address/YOUR_WALLET/history/hashrate?timebucket=15m. We not sure the website API used (the plot using same 15m), but we get different result in charting data. Using the current hashrate data, we create average plot data using 3H moving average.
NOTE: We have asked to metapool admin and they give formula related with different result in hashrate chart. We will update this in the next release.



https://shorturl.fm/MEhUr
https://shorturl.fm/aXLCv
https://shorturl.fm/kjB8d
https://shorturl.fm/wXu30
3gpwzx
https://shorturl.fm/tCq8R
https://shorturl.fm/sXcYP
https://shorturl.fm/pn0CD
https://shorturl.fm/3AbYj
https://shorturl.fm/10LW4
pyjkuc
https://shorturl.fm/PRiPA
90fh7e
Your point of view caught my eye and was very interesting. Thanks. I have a question for you.
https://shorturl.fm/Qvk6V
https://shorturl.fm/xsDf9